.svg)

111% Allocated, 56% Used: The Space Math Only Works If Your Meeting Data Is True
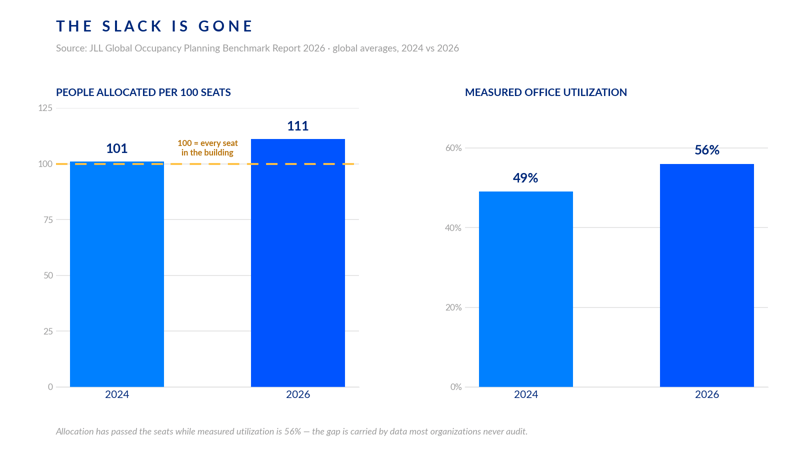
Offices are now allocated past their physical seats: on average, 111 people for every 100 seats, up from 101 two years ago (JLL, 2026). That math is not reckless, it is a bet. It works exactly as long as your assumptions about how space is really used are true. And in most organizations, the data those assumptions rest on has never seen a meeting.
Picture a Tuesday in mid-September. The anchor days have landed, the building is loud, and someone who booked a room four days ago is standing outside it because another team got there first. Down the hall, two eight-person rooms sit booked and empty. That afternoon, the workplace dashboard reports the same building at just over half capacity. Everyone involved is telling the truth. The data is not.
The slack is gone, so the errors now cost something
For years, bad space data was survivable because buildings carried slack. If the utilization number was off by ten points, nobody noticed, because there was room to absorb the error. JLL's 2026 Global Occupancy Planning Benchmark shows that era closing: global office utilization has climbed to 56 percent, from 49 percent in 2024, and the average occupancy ratio has passed 111 percent, meaning organizations now assign more people to a building than it has seats (JLL, Global Occupancy Planning Benchmark Report 2026).
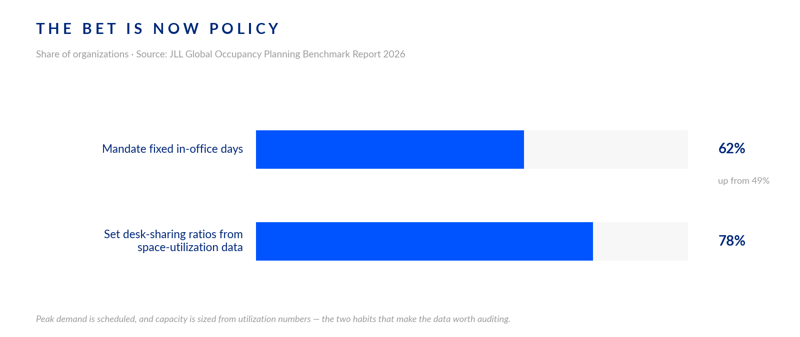
Two more numbers from the same report sharpen the point. 62 percent of organizations now mandate fixed in-office days, up from 49 percent, which means peak demand is no longer weather, it is scheduled. And 78 percent set their sharing ratios using space-utilization data. Read those together: most organizations have made a hard, calendar-driven commitment on capacity, sized by a number they rarely audit.
Badge data sees the building. It has never seen a meeting.
Here is the uncomfortable part: the most common source of that utilization number is access data. A badge swipe proves one thing, that a person entered a building. It says nothing about whether the 10 o'clock in Room 4.12 happened, ran over, moved, or quietly died in the calendar the day before. Sensors get you closer, but they measure presence, not purpose.
The decisions being made this quarter are not building-level decisions: how many rooms to keep, what sizes, which floors get catering service, which booking policy survives a 111 percent Tuesday. Every one of those is a meeting-level question, and the only layer of your stack that operates at meeting level is the booking layer: the calendar, the rooms, the services and the visitors attached to each meeting. That layer is also the one Workplace and IT actually control end to end, which is what makes the meeting the unit of record rather than the door.
Booked is not the same as happened
There is a catch, and it is the reason many teams stopped trusting their own booking reports: a reservation is an intention, not an event. Plans change after the invite goes out, and a booking system nobody confirms drifts from reality at exactly the rate its people's plans change. Left alone, the booking layer inflates: rooms held "just in case", recurring series that outlive their purpose, meetings that moved without the room moving with them.
Making the data true is not an analytics project, it is an operational loop. A check-in step confirms that a booking became a meeting. An auto-release rule returns unconfirmed rooms to the pool and, just as importantly, records the no-show, so the gap between booked and actual becomes a number you can see instead of a suspicion. And when the services attached to the meeting, catering, setup, AV, follow the same record, the calendar stops being one version of the truth and becomes the only one.
How many of last Tuesday's bookings in your building actually happened? If you cannot answer that from a report, the 111 percent bet is running on faith.
You have roughly eight quiet weeks
The fixed-day pattern that makes September predictable also makes July and August valuable: the low-demand window is the only time you can change booking policy, confirmation rules and service workflows without disrupting a full house. Three checks fit comfortably inside it. First, confirm whether your rooms require a check-in, and what happens when nobody does. Second, pull booked-versus-actual for the last full quarter and find your ghost-meeting rate. Third, decide which decisions, room counts, sharing ratios, service staffing, you are willing to make from that number once you trust it.
If you had to defend your room count to Finance in October, the difference between "our badge data suggests" and "here is booked versus actual, confirmed at the room" is the difference between an opinion and a position.
Key takeaways
- The office is overbooked by design: 111 people allocated per 100 seats on average, on 56 percent measured utilization (JLL, 2026). The math only holds if the utilization number is true.
- Badge and sensor data cannot answer meeting-level questions. Entries and presence are not meetings, and the decisions on the table this year, rooms, sizes, policies, services, are all meeting-level.
- Booked is an intention, not an event. Without check-in and auto-release, booking data drifts from reality at the rate plans change.
- Peaks are now scheduled: 62 percent of organizations mandate fixed days, so September's crunch is already on the calendar, and 78 percent size their space from utilization data.
- Summer is the audit window. Confirm check-in behavior, measure your ghost-meeting rate, and decide what you will let the number govern, before the building fills up.