.svg)
While the new ways of working remotely or hybrid benefit employees by providing a flexible work-life balance, it also presents a challenge for corporations to figure out how their expensive buildings could be used alternatively and more effectively.
Fortunately, with workplace analytics tools like AskCody Insights companies can start getting real-time data into meeting room bookings, desk utilization, reception, and services teams.
Defining workplace analytics
Workplace analytics refers to the use of data analysis to understand how employees are using the office with the goal of efficiently using the workspace. With cloud-based software like Microsoft Power-Bi, companies can track employee activities, which can help to make data-driven decisions. Workplace analytics can be used for utilization analysis, performance indication, and comparison between different offices.
Which workplace analytics are essential?
Workplace analytics is only valuable if you can put it to use. Here are a few examples of how you can effectively use workplace data in your organization:
Meeting room utilization: Your conference rooms are a big part of your office expenses. As such most companies would want to know how their meeting rooms are being utilized. With analytics on your meeting rooms, you can start to understand:
- Which conference rooms are hardly being used, and which are always booked
- Which period of time periods are meeting rooms usually booked creating potential bottlenecks
- Are meeting rooms utilized effectively in terms of capacity and actual attendance
Desk booking: If you currently use a desk booking solution that is integrated with Microsoft 365, you should be able to get utilization data and reports. You can compare data to figure out:
- Which bookable desks are utilized in our organization
- Which periods are our employees in the office
- Should we turn desks into meeting spaces
Service and reception analytics: You can track the complete visitor experience by getting data on your service teams and your reception. This could be data like
- Which periods do you see the most traffic in your reception?
- Which services are being requested, canceled, or rejected by users or the provider?
- Are receptionists spending time registering guests or are meeting planners registering visitors in Outlook?
With workplace analytics data, you can identify trends and use space more effectively to enhance productivity within your organization. If you would like to learn more about workplace utilization, you can find information on how we use workplace analytics on our platform here.
For more general information learn more about meeting management.
Types of workplace analytics
Workplace analytics is a tool that can have multiple purposes which is why it is commonly divided into four categories:
- Descriptive analytics: When you look at historical data, you can get a snapshot of how your organization has been performing. This type of analytics is like taking a picture of the past, but it doesn't tell you why things happened the way they did.
- Diagnostic analytics: If you want to understand why something happened in the past, you can use diagnostic analytics. This type of analytics helps you figure out the root cause of a problem by looking at historical data and trying to establish cause and effect.
- Predictive analytics: If you want to predict what might happen in the future, you can use predictive analytics. This type of analytics looks at existing data and uses it to make educated guesses about what might happen next.
- Prescriptive analytics: When you want to make informed decisions about the future, you can use prescriptive analytics. This type of analytics combines existing data with predictive modeling to recommend specific actions you can take to achieve your desired outcome. It's like having a personal advisor who can tell you what steps to take next.
Despite the benefits, these four types of analytics pose some challenges. One of the primary challenges is data privacy and security, as sensitive employee data must be protected. Another challenge is ensuring the accuracy and reliability of the data, as incorrect or incomplete data can lead to misguided decisions. Finally, organizations must ensure they have the necessary technology and skills to effectively analyze and interpret the data, as well as the resources to implement recommended changes. Workplace analytics tools can minimize these challenges and understandably visualize the data. But there are a lot of tools to choose from...
4 workplace analytics applications
Multiple applications offer advanced workspace analytics capabilities. In this section, we'll compare the analytics software of 4 popular applications: Power BI, AskCody Insights, Looker, and Tableau.
Microsoft Power BI and its endless possibilities
Microsoft's Power BI is a tool that lets users visualize and analyze data reports connected to various sources, including Excel spreadsheets, cloud services, streaming data, etc. It offers real-time updates, easy sharing, and remote data access. Microsoft Power BI is a powerful analytics tool if used correctly. However, Microsoft Power BI is complex, and few people have the skillset to set up prolific workplace data analytics. But if you have an expert in-house or externally, you can take advantage of the countless integrations with applications and services.
![]()
Pros:
- Powerful integration
- Powerful analytical capabilities
- Create interactive dashboards
- Highly customizable
- Offers easy data transformation
- Uses Artificial Intelligence
Cons:
- Complex and challenging to use.
- Lacks data cleaning.
- Performance issues with large data sources.
- Limitations in data sharing.
Power BI transforms data into visuals, offers real-time updates, and integrates with most applications. It has powerful analytical capabilities and a free initial setup but can be challenging to use and lacks data cleansing solutions. Whether or not Power BI is suitable for your business intelligence needs depends on your specific requirements and expertise with the software.
AskCody Insights helps you understand your workplace with Microsoft data
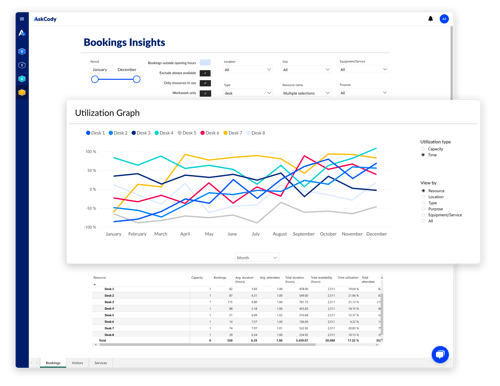
AskCody Insights is a powerful workplace analytics tool that provides quantifiable data to monitor the utilization of meeting spaces, desks, and services as well as visitor traffic. With Insights, organizations can see their office and meeting rooms in full context with all available data, allowing them to optimize available spaces across the entire organization.
Insights offer detailed filtering and data export capabilities, enabling customized reports on specific rooms, facilities, locations, equipment, and purposes. This allows organizations to dig deeper into workplace analytics, identifying meeting rooms that are rarely used or often not occupied to full capacity.
With weekly reporting of key metrics, Insights helps organizations make data-driven decisions to enhance their meeting and office spaces. By utilizing workplace analytics, organizations can optimize resources, control meeting room booking behavior, and improve room utilization.
Since AskCody Insights is powered by Power BI it is taking advantage of all its capabilities as well as reducing the required skillset and technical complexity to set the data up.
With AskCody Insights you are able to view workplace analytics like bookings:
![]()
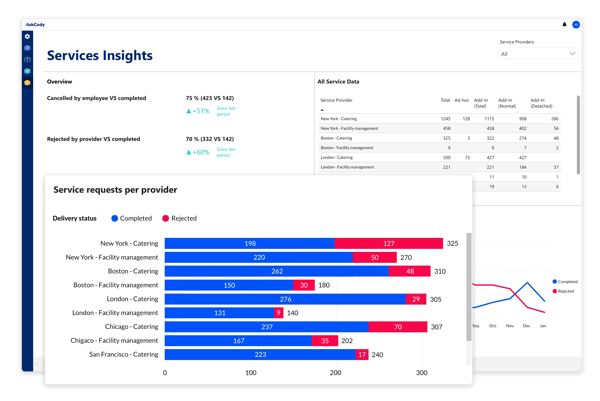
You can track the performance of your services team to see the number of service orders being accepted, canceled, or deleted.
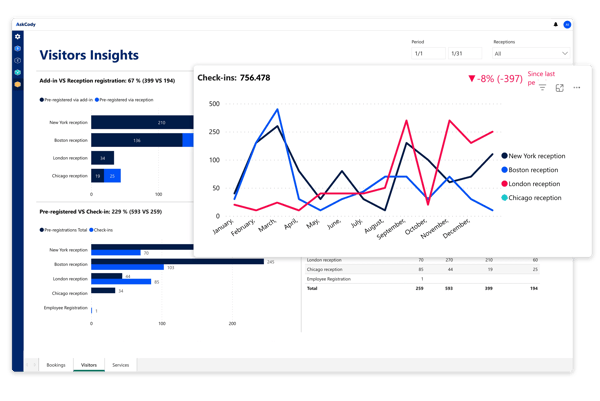
You are also able to track your receptions performance by viewing, how many people are coming to your office:
Pros:
- Powerful integration with Microsoft
- Intuitive layout with quick and easy access of the collected data
- Powerful analytical capabilities and reporting options
- Offers easy data transformation
Cons:
- A Microsoft-based solution only - so no connection to Google.
- Not possible to identify if participants join physically or online (till Microsoft Teams update how participants attend)
In summary, AskCody Insights offers a simple and efficient way to analyze workplace data, providing the necessary insights to optimize office spaces, facilities services and visitor management. Use workplace analytics to monitor utilization and make data-driven decisions for a more productive and efficient workplace that is tailored to its needs
One of the most popular is Tableau by Salesforce
Tableau is a user-friendly business intelligence tool that allows users to create, modify, and share dashboards with others. It offers a wide range of data display and linking options that enable users to compare data sets easily. It also provides specific access permissions to control who can view, edit, publish, and share resources, information, data sources, and even parts of a selected dashboard. Tableau integrates with various applications, such as Periscope, internal CDP, and Iterable, and offers APIs for easy integration.
Pros:
- Large library of charts and highly interactive dashboards
- Supports a variety of data connections
- Highly compatible among devices
- Helpful user community
- Various ways to display and link data
- Specific access permissions
- Integration with other applications
Cons:
- Focuses primarily on visualization and requires pre-cleaning of data
- Lacks data modeling and data dictionary capabilities for Data Analysts
- Lacks version control and collaboration when building data logic and dashboards
- Can be expensive compared to other BI tools
Overall Tableau allows easy creation, modification, and sharing of dashboards. It has specific access permissions and integrates with various applications through APIs. Despite its benefits, Tableau has limitations, including a focus on visualization, lack of data modeling and dictionary capabilities, and limited collaboration for team projects.
Googles Looker for advanced flexibility in visualizing
Looker is a cloud-based analytics and business intelligence platform that enables users to integrate, explore, and visualize data using LookML, a data modeling language. Looker supports a wide range of data sources and visualizations and can be embedded in websites, portals, and applications.
Pros:
- Tremendously powerful data modeling capability that can cover a variety of analytical use cases.
- Fairly easy for the non-technical team to create reports from a pre-defined set of data.
- Looker supports collaboration and version control with Git Integration.
- Looker's pre-sale team is very helpful and supportive. They will go side-by-side with you for your initial setups.
Cons:
- Steep learning curve (have to acquire LookML skills to work with models).
- Require a strong data team with a high level of data maturity to manage.
- LookML projects and do all the setups for your business team.
- Looker can only work directly with one database per project and does not offer ETL capability.
Overall, Looker is a powerful platform for data modeling and visualization but may require significant investment in time and resources to fully utilize its capabilities.
Conclusion
Workplace analytics refers to the use of tools and software to measure and assess an organization's workspace utilization. It enables managers to track and analyze data securely, offering valuable insights into workspace utilization.
Fortunately, applications like Microsoft Power BI, Tableau by Salesforce, and Looker offer advanced analytics capabilities with little overhead to the end user. These applications have advantages and disadvantages and should be evaluated based on specific business intelligence needs and expertise with the software.
In conclusion, workplace analytics provides valuable insights into workplace utilization and its effectiveness. With the rise of remote work, it has become increasingly essential for organizations to have tools to monitor and assess their workplace. With the help of workplace analytics, businesses can optimize hybrid work strategies, improve their internal processes, and enhance productivity within their organization.